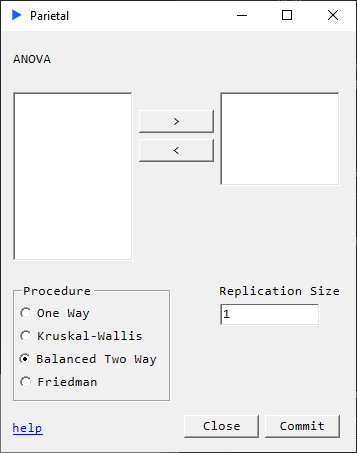
ANOVA
Analysis of variance tests differences among means by analyzing variance.
| Test | DV | Number of Groups | Type of Group |
|---|---|---|---|
| One Sample t-Test | Compares means | Compares a sample to the population | Population |
| Two Sample independent t-Test | Compares means | Compares two samples | Independent (unrelated) |
| Two sample dependent t-Test | Compares means | Compares two samples | Dependent (related) |
| Between groups ANOVA | Compares means | Compares two or more levels of an IV | Independent (unrelated) |
| Repeated Measure ANOVA | Compares means | Compares two or more levels of an IV | Dependent (related) |
| Mann-Whitney U | Ranked data or Not normally distributed | Compares two groups | Independent (unrelated) |
| Wilcoxon Match-Pair Signed-Rank test | Ranked data or Not normally distributed | Compares two groups | Depended (related) |
| Kruskal-Wallis One-Way ANOVA | Ranked data or Not normally distributed | Compares two or more groups | Independent (unrelated) |
| Friedman’s test | Ranked data or Not normally distributed | Compares two or more groups | Dependent (related) |
IV: independent variable
DV: dependent variable
One Way ANOVA

Description
Parametric test to compare means of multiple (three or more) samples.
$H_{0}$ : the central values of all data distributions are equal
$H_{a}$ : at least one of the central values is different
Assumptions:
- Dependent variables (more accurately its residuals) are normally distributed
- Variances are homogenous
- Independent samples
Returns
| Source | SS | DF | MS | F | P |
|---|---|---|---|---|---|
| $Treatment\hspace{1mm}$ | $SST\hspace{3mm}$ | $k-1\hspace{3mm}$ | $SST/(k-1)\hspace{3mm}$ | $MST/MSE\hspace{3mm}$ | $p$ |
| $Error\hspace{1mm}$ | $SSE\hspace{3mm}$ | $N-k\hspace{3mm}$ | $SSE/(N-k)\hspace{3mm}$ | ||
| $Total\hspace{1mm}$ | $SS\hspace{3mm}$ | $N-1\hspace{3mm}$ |
Example
The following dataset is taken from Introduction to Statistics by Lane et al.
Data Format 1:
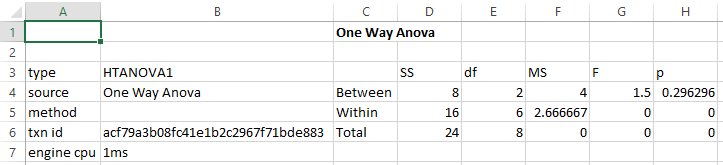
Suppose our dataset is of the form:
| Group 1 | Group 2 | Group 3 |
|---|---|---|
| 3 | 2 | 8 |
| 4 | 4 | 5 |
| 5 | 6 | 5 |
We can run a one-way anova using:
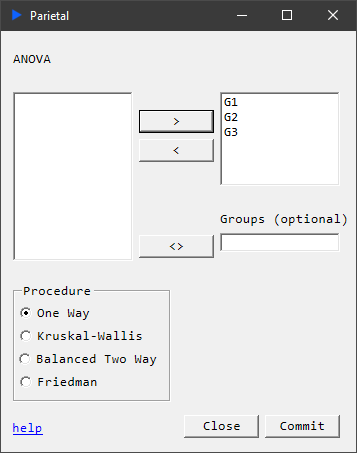
This produces the following table:
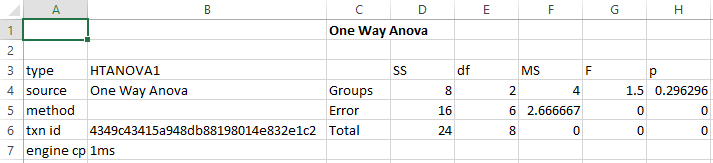
Data Format 2:
Another way of formatting the table for analysis is as follows. The advantage of this is that the number of elements per group do not have to be the same.
| Group | Y |
|---|---|
| 1 | 3 |
| 1 | 4 |
| 1 | 5 |
| 2 | 2 |
| 2 | 4 |
| 2 | 6 |
| 3 | 8 |
| 3 | 5 |
| 3 | 5 |

This produces the following table:
Example Reference: One-Factor ANOVA. (2021, January 10). Retrieved July 19, 2021, from https://stats.libretexts.org/@go/page/2175
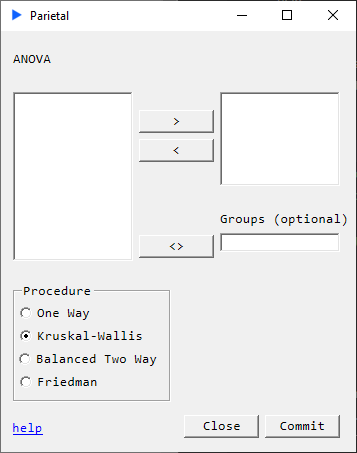
Kruskal Wallis
Description
Nonparametric test to compare means of multiple samples.
$ H_{0} $ : the central values of data distributions are equal
$ H_{a} $ : at least one of the central values is different
Assumptions:
- Continuous distributions
- Independent samples
Returns
| Source | SS | DF | MS | F | P |
|---|---|---|---|---|---|
| $Treatment\hspace{1mm}$ | $SST\hspace{3mm}$ | $k-1\hspace{3mm}$ | $SST/(k-1)\hspace{3mm}$ | $MST/MSE\hspace{3mm}$ | $p$ |
| $Error\hspace{1mm}$ | $SSE\hspace{3mm}$ | $N-k\hspace{3mm}$ | $SSE/(N-k)\hspace{3mm}$ | ||
| $Total\hspace{1mm}$ | $SS\hspace{3mm}$ | $N-1\hspace{3mm}$ |
Balanced Two Way ANOVA
Description
Determines the difference between means in unrelated groups across two factors. This is an extension of the one-way ANOVA where there is only one factor.
$ H_{0}: \begin{cases} \text{population means of the factor A are equal} \\ \text{population means of the factor B are equal} \\ \text{no interaction} \end{cases} $
Assumptions:
- Residuals must be normally distributed for each combination of levels of the independent variables
- Variances are homogenous
- Independent samples
Returns
$$ \scriptscriptstyle \begin{matrix} Source & SS & DF & MS & F & P \\ Factor A & SSA & k-1 & SSA/df_{A} & MS_{A}/MS_{E} & p \\ Factor B & SSB & j-1 & SSB/df_{B} & MS_{B}/MS_{E} & \\ Interaction & SSAB & (k-1)(j-1) & SSAB/(df_{A}df_{B}) & MS_{AB}/MS_{E} & \\ Error & SSE & kj(r-1) & SSE/df_{E} \\ Total & SST & rjk-1 \end{matrix} $$
Friedman

Description
Nonparametric alternative to repeated measures two-way ANOVA.
$H_{0}$: the distributions are equal across repeated measures
$H_{a}$: the distributions are different across repeated measures
Returns
- ANOVA table