Location Tests
Signed Rank Wilcoxon
Description
This is a nonparametric test for paired groups, i.e. does not assume normality in the data. Typically the t-Test is used for testing that the difference between population means for two paired samples are equal. But in cases where this assumption is violated, we can use the Wilcoxon Signed Rank Test. The test is based on analyzing the signs of the differences as well as the magnitude of the differences.
The test statistic is: $$ T = \sum_{i=1}^{n}sgn(X_{i})R|X_{i}| $$ where $ R|X_{i}| $ denotes the rank of $ |X_{i}|,…,|X_{n}| $ where the rankings are from low to high.
| Tail | Alt. Hypothesis |
|---|---|
| $left\hspace{1cm}$ | $H_{1}: \theta_{X} \lt \theta_{Y}: $ Distribution of $Y$ shifted to the right wrt to $X$ |
| $right\hspace{1cm}$ | $H_{1}: \theta_{X} \gt \theta_{Y}: $ Distribution of $Y$ shifted to the left wrt $X$ |
| $both\hspace{1cm}$ | $H_{1}: \theta_{X} \neq \theta_{Y}: $ Distribution of $Y$ shifted in either direction wrt $X$ |
Example
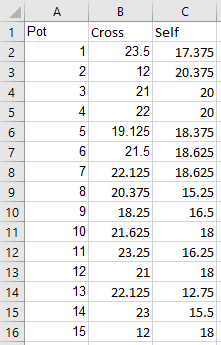
We consider the Charles Darwin’s Zea Mays dataset (easily available on the web).
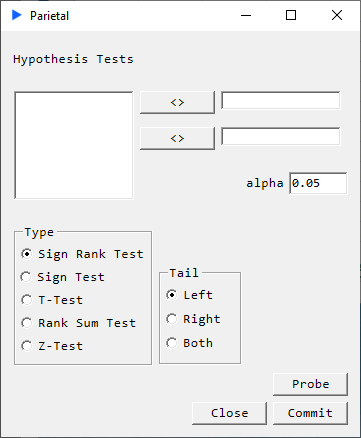
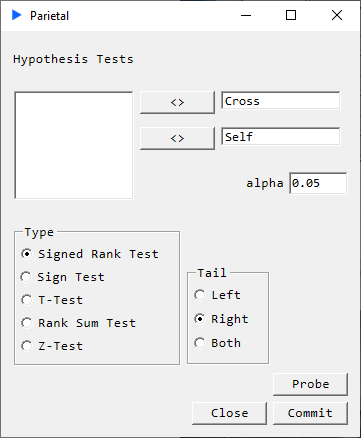
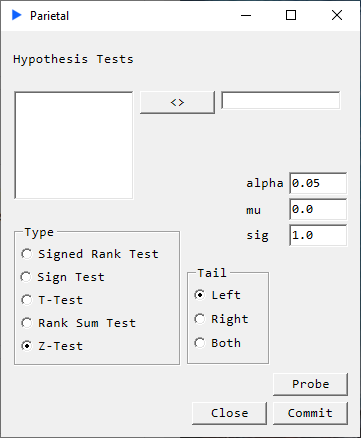
Select the region of data then go to Parietal -> LOC and set up a right-tailed test:
Hit Probe to see the results without writing anything to the worksheet.
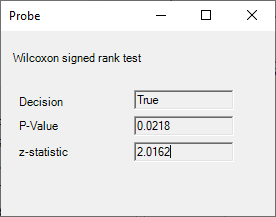
Returns
- p-value
- decision
- z-statistic
Reference: Hogg McKean Craig 8th
Sign Test

Description
The Sign Test is a nonparametric test which tests if the population means between two paired samples are equal. This is very much like the Wilcoxon Signed Rank Test but without the assumption of symmetric distribution of the differences around the median and without using the magnitude of the difference.
The sign statistic can be expressed as: $$ S(\theta_{0})=\sum_{i=1}^{n}I(X_{i}>\theta_{0}) $$
| Tail | Alt. Hypothesis |
|---|---|
| $left\hspace{1cm}$ | $ H_{1}: \theta_{X} \lt \theta_{Y}: $ Distribution of $Y$ shifted to the right wrt to $X$ |
| $right\hspace{1cm}$ | $ H_{1}: \theta_{X} \gt \theta_{Y}: $ Distribution of $Y$ shifted to the left wrt $X$ |
| $both\hspace{1cm}$ | $ H_{1}: \theta_{X} \neq \theta_{Y}: $ Distribution of $Y$ shifted in either direction wrt $X$ |
Example
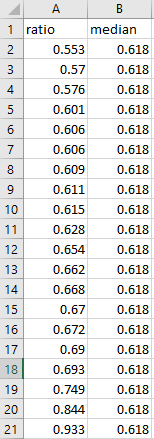
We consider the Shoshoni rectangle dataset (easily available on the web) and the example 10.2.1 in Hogg McKean Craig 8th. The test the hypothesis: $ H_{0}: \theta=0.618 \text{ versus } H_{1}: \theta \neq 0.618 $. We add a column called median to test against our hypothesized median of 0.618.
Select the region of data then go to Parietal -> LOC and set up a two-tailed test:
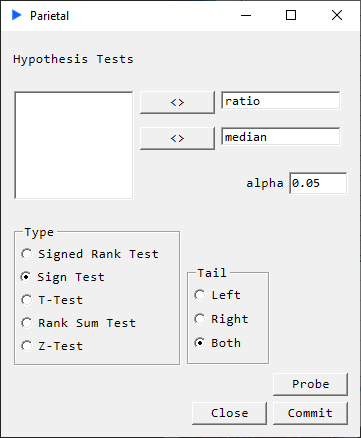
Hit Probe to see the results without writing anything to the worksheet.
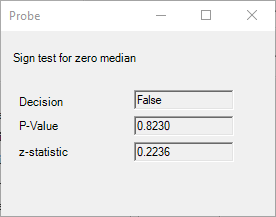
Returns
- p-value
- decision
- z-statistic
Reference: Hogg McKean Craig 8th
T-Test
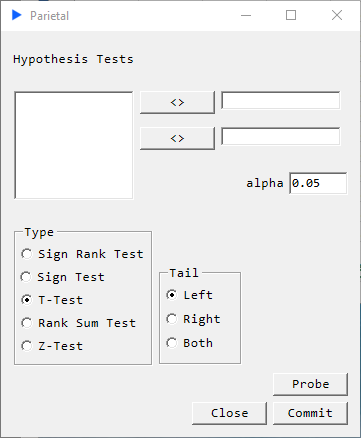
Description
Paired t-Test: Determines if there is a significant difference in the means two paired groups.
Assumptions:
- Paired groups
- No significant outliers
- Differences are normally distributed
| Tail | Alt. Hypothesis |
|---|---|
| $left\hspace{1cm}$ | $ H_{1}: \theta_{X} \lt \theta_{Y}: $ Population mean of $Y$ shifted to the right wrt to $X$ |
| $right\hspace{1cm}$ | $ H_{1}: \theta_{X} \gt \theta_{Y}: $ Population mean of $Y$ shifted to the left wrt $X$ |
| $both\hspace{1cm}$ | $ H_{1}: \theta_{X} \neq \theta_{Y}: $ Population mean of $Y$ shifted in either direction wrt $X$ |
Returns
- p-value
- decision
- t-statistic
Rank Sum Test

Description
This is a nonparametric alternative to the two-sample t-Test. It is used to test if two groups are likely to derive from the same population. The measure for this is interpreted as comparing medians between the two groups.
| Tail | Alt. Hypothesis |
|---|---|
| $left\hspace{1cm}$ | $ H_{1}: \theta_{X} \lt \theta_{Y}: $ Median of $Y$ shifted to the right wrt to $X$ |
| $right\hspace{1cm}$ | $ H_{1}: \theta_{X} \gt \theta_{Y}: $ Median of $Y$ shifted to the left wrt $X$ |
| $both\hspace{1cm}$ | $ H_{1}: \theta_{X} \neq \theta_{Y}: $ Median of $Y$ shifted in either direction wrt $X$ |
Returns
- p-value
- decision
- t-statistic
Z-Test
Description
This one-sample location test determines if the mean of X derives from a normal distribution with mean $\mu$ and standard deviation $\sigma$.
| Tail | Alt. Hypothesis |
|---|---|
| $left\hspace{1cm}$ | $ H_{1}: \mu_{X} \lt \mu: $ Mean of $X$ shifted to the left wrt to $\mu$ |
| $right\hspace{1cm}$ | $ H_{1}: \mu_{X} \gt \mu: $ Mean of $X$ shifted to the right wrt $\mu$ |
| $both\hspace{1cm}$ | $ H_{1}: \mu_{X} \neq \mu: $ Mean of $X$ shifted in either direction wrt $\mu$ |
Returns
- p-value
- decision
- z-statistic
Reference: Hogg McKean Craig 8th